Failure of trees may threaten people and properties, especially in high population dense city. Visual assessment may not fully evaluate the internal condition. Internal decay is a major source of mortality for mature trees because trees structurally weakened by heart rot and butt rot are more susceptible to snapping and falling in heavy winds or precipitation (Putz et al., 1983; Worrall and Harrington, 1988; Shaw et al., 2004). Root decay is also associated with tree failure causing tree windthrow. A detailed examination is needed to suspect those defects and measure the severity. Try to obtain more information and make an advanced tree assessment. To minimize the risk of the tree to accept level.
There two tree defect detection systems which can help to measure the extent of decay and investigate the internal condition of trees.
1. Sonic Tomograph

Sonic tomography has been developed by Argus Electronic GmbH (Rostock, Germany). It is measuring variation in the velocity of the sound wave transmitted through detective part. Analyze the visual image tomograph to evaluate decay patterns and structural integrity.
This device provides an efficient, less invasive approach to irregularly shaped living trees.[6] It can measure the cross-section of the branch, trunk, root nearly close to ground buttress root revealing important safety information about the breaking risk. Soundwave travels solid or high-density wood faster than decayed wood and cavities. Identify the different velocity of a sound wave to determine the thickness of the residual wall on trees with internal decay or cavity.
The algorithms are then sent to a computer or handheld device via Bluetooth and expressed as a 2-dimensional diagram with color code showing the state of decay. The individual segments can later be stacked to show a 3-dimensional diagram of the decay patterns, after which appropriate treatment can be determined. [6]
Accurately measuring decay in a standing tree requires six steps:
(1) visual inspection and photographic documentation of the trunk,
(2) strategic placement of the sonic sensors,
(3) measurement of a precise geometry of sensor placement,
(4) sonic measurement,
(5) visualization of the resulting pattern,
(6) quantification of patterns of compromised wood from the images.


Stem Analysis Sonic Tomograph
The PiCUS Software calculates 2D tomograms that show the ability of the wood to transmit sonic waves. The tomogram allows measuring the residual wall thickness.
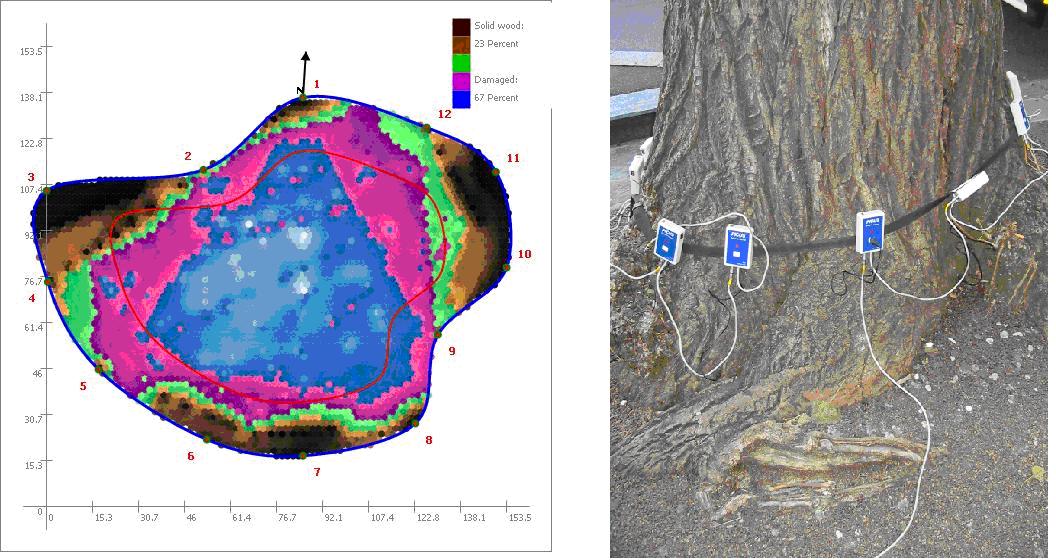
Solid wood is in brown color. The lower density of wood indicates in green and magenta color. The blue area in the center of the sonic tomograph is most likely a dry cavity.
2. Resistograph

[Citation 4]
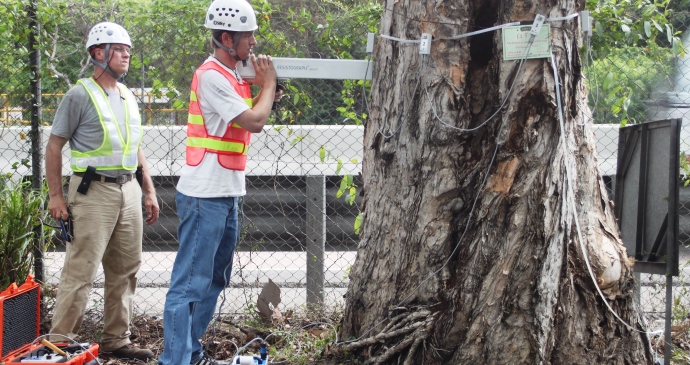
Resistograph is an electronic drilling instrument to detect internal decay developed by Frank Rinn (since 1986 in Heidelberg, Germany). This measure resistance when drilling through the defective part such as trunk, branch, root flare. It drills 1.5mm wide and 45cm long needle into a tree. The plotting graph indicates the degrees of resistance.
The less resistance the softer wood which means probably the presence of decay, cavities or cracks. The result can be recorded and printed on site. A high linear correlation between the measured values and the density of the detected wood are provided. It is an advanced tree assessment to examine wood density, growth rate, and internal condition.

Digital control panel with direct and easy press button for clearly display under sun light operation. Drilling depth, drilling speed can be set easily.
[Citation 4]

Bluetooth wireless printer printing out 1:1 scale result on site, it’s easy and fast to compare the measurement with the detected part. Connect to a smartphone or tablet for display profile. [Citation 4]
Accurately measuring decay in a standing tree requires following steps:
(1) visual inspection and photographic documentation of the trunk,
(2) strategic to place the drilling instrument with angle if need,
(3) drilling the detective area,
(4) Print out the result for analysis.

The less resistance the softer wood which represents different wood density, cracks, decay, and cavities can be determined.
Appraisal of tree defect detection system
Ease of use
Resistograph is easier to operate than sonic tomograph. Both are used after Visual Tree Assessment(VTA) discovering suspected defects. Both can get an instant result on site at the time of inspection.
The weight of resistograph is heavy for women or long time use. It is not convenient to deliver to site, the location such as on slope or far away from roadside no car can drive in. The lighter and smaller device is preferred.
Result analysis
Professional training and informative protocol are needed for both measures to interpret the result.
Resistograph provide a fast screening result with low resolution. The plotted graph of resistograph is simpler to understand and do analysis for the extent of internal defects. Resistograph drill into tree at any angle and the area near root collar. [Citation 10]
Tomograph provide a slow but diagnostic result with colored high resolution. The colored diagram of tomograph are not easy to analyze, training and supervision by experienced technician should be provided. Tomograph result is limited to horizontal analysis. Highly irregular trunk or root flares are difficult to obtain a precise measurement. Abnormal data or errors may be induced from deviating setup. Beginner was hard to use and make inaccurate data easily. Additional standardized images should supplement to the protocol and quantify the proportion of trunk area that shows decay expands in tree risk assessment.
Invasiveness to the tree
Resistograph is invasive to tree by drilling holes which will induce pest, fungi and bacteria intrusion. Beginner should be guided by experienced users during operation on site. For sure correct use of resistograph. Avoid over drills inducing further health problem by infection of pest and disease. Tomograph is less invasive approach than resistograph.
Effectiveness of detecting tree internal condition
Both instruments provide visual results and effectively to locate the cavity inside the tree. Quantifying result can be obtained.
Limitation
Resistograph has incidents during inspection. Bending of the needle when drilling may occur deviation. Accidentally stuck the needle in the tree cannot be removed, occurs damage to the internal structure. Wood breaking strength cannot be determined.
Resistograph limited by the length of probe. For the tomograph, which is hard to measure highly irregular trunk. Due to the transmission of sound waves is passing in straight lines, transmitter and receiver cannot receive the signal if fail to set on same horizons straight line, situations are illustrated in below diagram.

PiCUS 3 Sonic Tomograph sensor placement on tree trunks of different shapes. (A) Regularly shaped tree using recommended equidistant spacing of sensors (T-shape with numbers 1–12). All chords (e.g., 1–4, 4–8, 8–12, 9–10) including the diameter chord (1–7) are appropriately complete (shown as dashed lines) within the outline of the trunk. (B) Oval trunk with decay cavity (rough shaded region) open on one side. All sensors are placed around the outline of the trunk, avoiding the decay cavity. All chords (e.g., 1–2, 1–4, 1–7, 4–8, 8–12) are complete (dashed lines) within the trunk outline. Chords 1–2, 1–4, and 1–7 cross the internal decay cavity, but are within the outline of the presumed intact trunk. Sound transit time for those chords will be longer than expected for that distance (indicating decay), because the sound must either take a longer path or move more slowly through the less dense medium in the cavity. (C) Incorrect placement of sensors on an irregularly shaped tree trunk. Chords with dashed lines are contained within the trunk outline, but chords 2–12, 3–11, 4–12, and 9–10 are incomplete (shown as dotted lines), because they all pass outside the natural tree outline. Sound transit time will be longer than expected for those chords, and can produce false positives on the tomogram as if they passed through decay cavities. Instead, (D) and (E) show correct placement of sensors for more effective scanning of the same irregularly shaped trunk as in (C) by dividing the trunk into two separate scanning regions (D: sensors 1–12 and E: sensors i–viii) to allow piece-wise scanning. Within each section, all chords are complete (dashed lines), providing robust measures of each part of the trunk. A small shaded region between the two components is not scanned. (F) Cross-section of trunk with buttresses. Fig. 1 (See p. 2). Scanning ideally excludes the buttresses and focuses on the internal core of the trunk, by carefully placing sensors so that all chords are complete (dashed lines). If required, buttresses could be separately scanned by modifying the approach shown in D and E. Buttresses and other irregularities often make measuring particular chord lengths physically difficult (e.g., chord 2–4 in G and H). If the chord (2–4) is extended to a point (marked x) that is more easily accessed with the PiCUS electronic tree calipers (G), the chord length 2–4 can be determined by measuring 2–x and 4–x and then finding the difference between the two. (H) Alternatively, posts can be extended from the sensor points at right angles to the 2–4 chord and parallel to each other, and then the distance between them measured with a ruler. Long-jaw straight calipers can sometimes be used for this measurement if the chord distance is not too great. [6]
Price
Both are expensive machine. Tomograph is more expensive than resistograph. Price might vary with different model. [9]
Conclusion
Sonic tomograph and resistograph have been evaluated and compared with different criteria. In practically, the use of tools depends on the cost of the tools, ease to use, invasiveness to trees, and effectiveness of the detection. In my company, using resistograph is more than tomograph to examine the internal condition of tree. Easy to handheld and can examine a numerous tree in a day. Because of the result is easy to interpret, and fast examination process.
If need in-depth inspection, need to confirm the precise extent of decay, shapes, and location, tomograph is surely adopted. Experienced staff handle, time-consuming to do the examination and analysis of the color diagram.
Citation
[1] Picus Sonic Tomograph – Indispensable For Stem Analysis
JAC Systeme GmbH – http://www.argus-electronic.de/en/tree-inspection/products/picus-sonic-tomograph-indispensable-for-stem-analysis
[2] Picus Tree Motion Sensor 3
JAC Systeme GmbH – http://www.argus-electronic.de/en/tree-inspection/products/picus-tree-motion-sensor-3
[3] Wikipedia contributors. (2018, July 12). Resistograph. In Wikipedia, The Free Encyclopedia. Retrieved 04:06, December 12, 2018, from https://en.wikipedia.org/w/index.php?title=Resistograph&oldid=849890394
[4] Rinntech Resistograph R650
https://www.arbor.tools/rinntech-resistograph/
[5] Arbotom Sonic Tomograph Products
https://www.arbor.tools/product-category/rinntech/arbotom-sonic-tomograph/
[6] Gilbert GS, Ballesteros JO, Barrios-Rodriguez CA, et al. Use of sonic tomography to detect and quantify wood decay in living trees. Appl Plant Sci. 2016;4(12):apps.1600060. Published 2016 Dec 16. doi:10.3732/apps.1600060
[7] Picus Sonic Tomograph (tree Ultrasound)
https://www.naturallytrees.com.au/picus_sonic_tomograph_ultrasound.html
[8] Tomograph and Resistograph Services
https://www.atptree.com/en/tree-consulting-services/tomograph-resistograph-services/
[9] United States Forest Sevice website
https://www.fs.fed.us/t-d/programs/im/tree_decay/tree_decay_detect_equip.shtml
[10] Eng-Choon Leong , Daniel C. Burcham & Yok-King Fong (2012) A purposeful classification of tree decay detection tools, Arboricultural Journal: The International Journal of Urban Forestry, 34:2, 91-115, DOI: 10.1080/03071375.2012.701430
